 English
 Čeština
Ansoff Matrix framework
We're building a comprehensive knowledge library about product development as part of our mission. The library is for anyone looking to make better decisions — primarily decisions about how to further develop a product. Whether you're an inventor, a product manager, or a Chief Product Officer, using a structured decision-making method increases your chances of building the right things for the right audience (build the right thing for the right audience). Today we'll introduce the Ansoff Matrix framework.
Framework name: Ansoff Matrix matrix.
Inventor: Harry Igor Ansoff.
Year of first use: 1957.
Link to the author's original research:
Article Strategies for Diversification. Book: Corporate Strategy: An Analytic Approach to Business Policy for Growth and Expansion (1965).
Key figures in the framework's development:
Unknown.
Key milestones in the framework's development:
Development of the matrix into a strategic planning tool for corporations (1965).
History of First Use
The framework helps clarify a company's options for growth. Any company always has four growth strategies: increasing market penetration, developing the market, developing new products, and diversification. Each strategy represents a significant — and often irreversible — decision.
According to the framework, all four strategies can be pursued at once, which is the mark of a well-run company. Diversification, however, is demanding enough that it often drives organizational change across the whole company, whereas the other three follow a similar development path within the company.
Basic Prioritization Principles
The core idea of the matrix is to answer how a company will look for new sources of revenue, what risk that involves, and whether diversification is the best route.
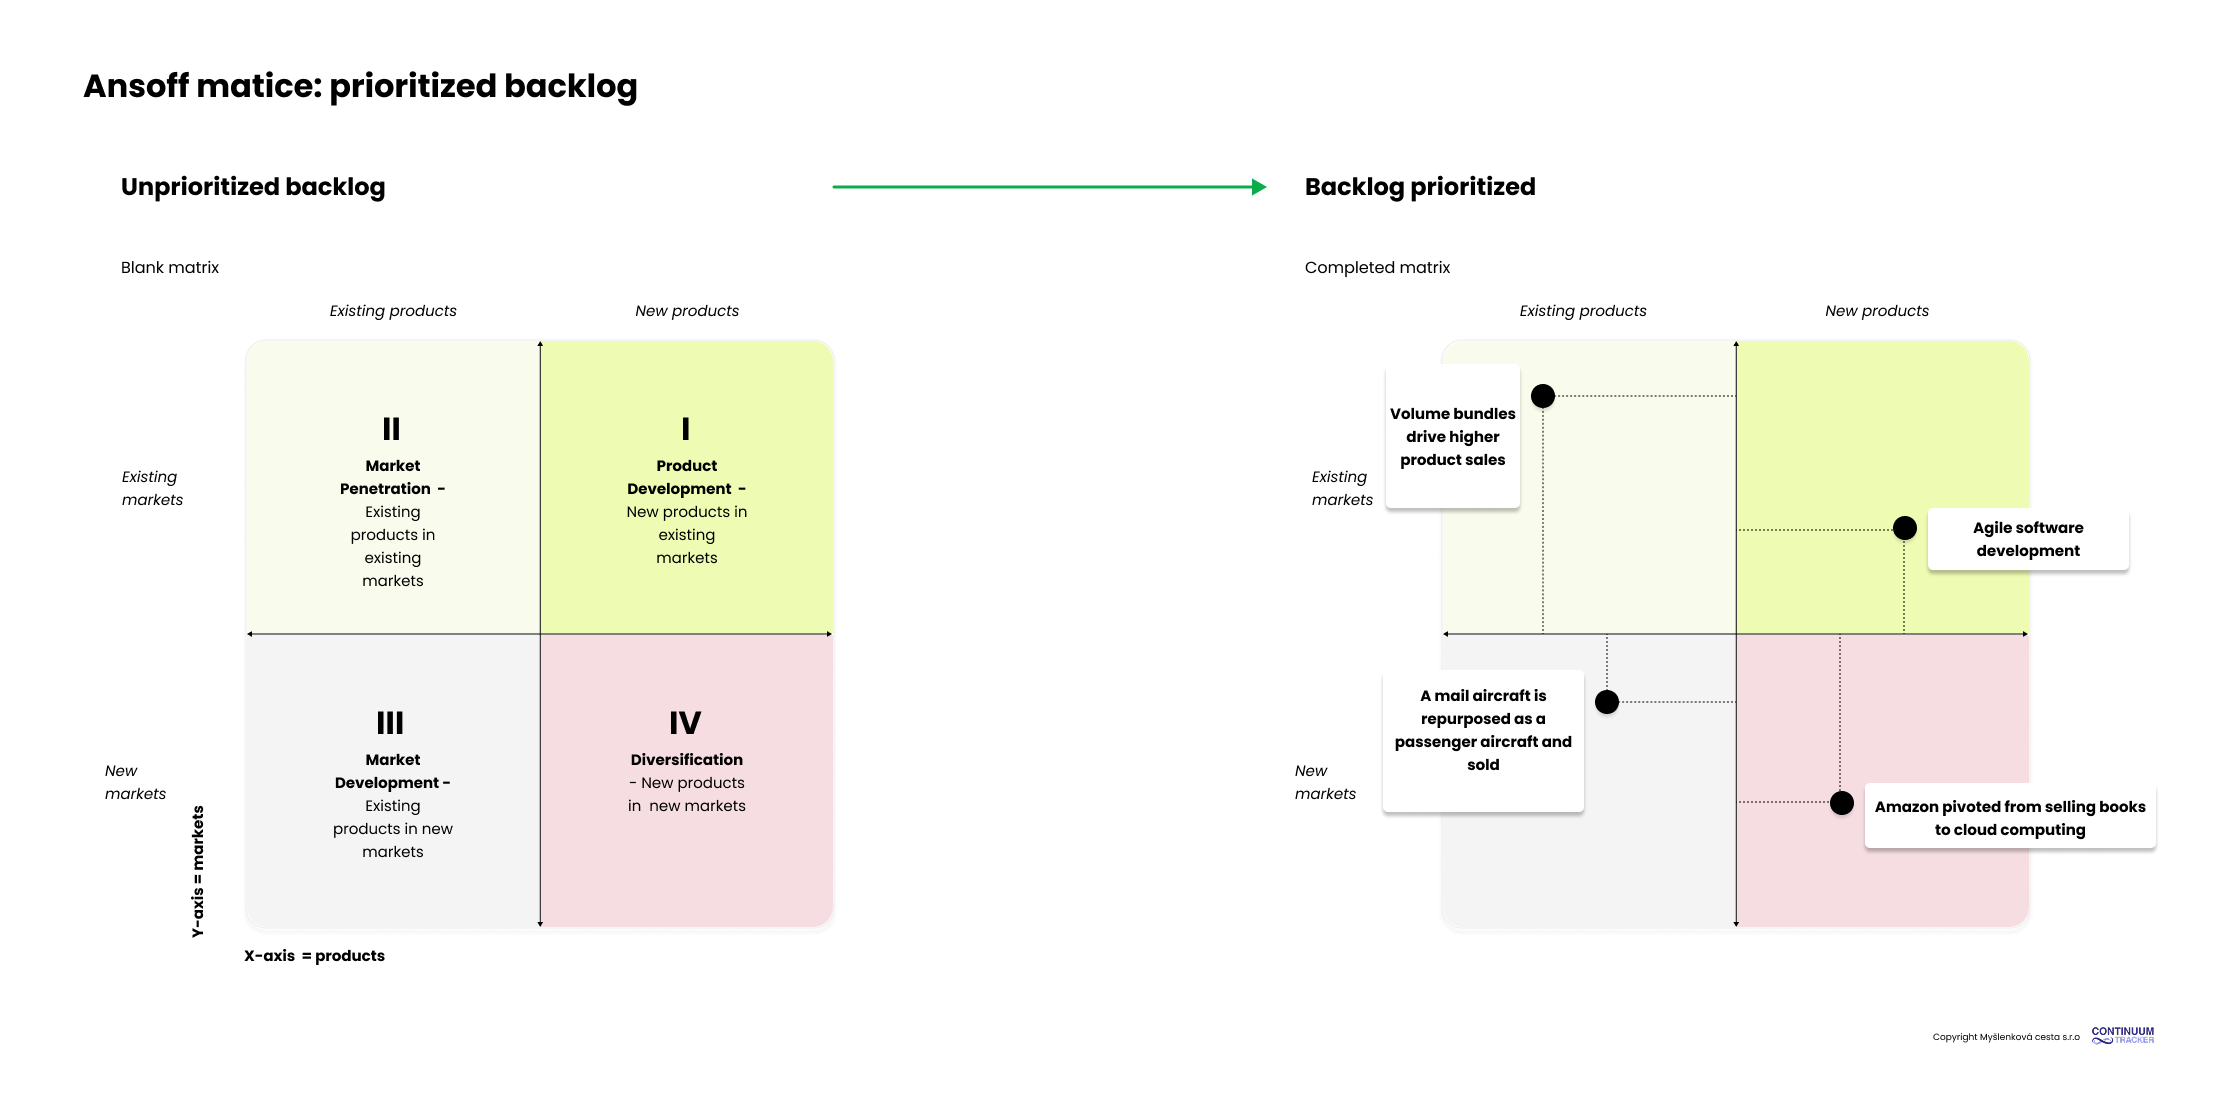
The matrix has two axes and four quadrants representing four strategies for prioritizing a company's growth:
Products = the X axis shows product lines. In the original article this refers to product lines.
Markets = the Y axis shows markets. In the original article this refers to product missions.
Each product line has:
a set of physical properties (e.g. size, color), and
performance properties (for example, the number of messages processed per minute).
Every product also has a certain "mission" — the job it is meant to do (for example, a broom's job is to sweep up dirt; its reason for existing).
So when we talk about a company's product-market strategy — known today collectively as the GO-TO-MARKET strategy — we always combine individual missions with product lines. This lens lets us view a company's growth through four strategies.
The result of prioritization is a kind of compass, an alignment of the business strategy within the management team, rather than specific recommendations about individual products or markets. Because this is an estimate of risk and growth strategy, the combinations are simplified to four options. In practice, though, there are far more than four possible combinations.
Quadrant I - Product Development
The "top-right" quadrant represents Product Development and stands for the effort to change the physical and performance parameters of an existing product line without changing its "mission".
In terms of risk, this strategy is low to medium risk among the four options. The big headache is always the question: "Which physical and performance parameters should we develop further?" The strategy draws on the loyalty of existing customers by offering them new products.
Typical tactics are:
Standard product development of new, larger features,
Collecting feedback on an existing product, analyzing it, and then developing new products for existing markets,
Developing new market propositions (value propositions) and marketing strategies that generate demand for a new product.
Quadrant II - Market Penetration
The "top-left" quadrant represents Market Penetration and stands for the effort to increase a company's sales without changing the product line or its GO-TO-MARKET strategy.
In terms of risk, this is the least risky of the four strategies, because it relies on existing knowledge of both the market and the product. It therefore involves few unknowns. The strategy doesn't require large investment, but its potential has limits.
Typical tactics are:
Increasing marketing effort to win new customers,
Small product improvements to boost customer loyalty and repeat purchases,
Changing the product's price to increase sales,
Growing market share through acquisitions.
Quadrant III - Market Development
The "bottom-left" quadrant represents Market Development and stands for the effort to adapt an existing product line to new "missions".
In terms of risk, this strategy is low risk, because it involves known products but new markets. It lets companies find new demand for their products.
Typical tactics are:
Adapting the product or marketing for a new demographic,
Entering a new market — often framed geographically, though in his article Ansoff sees a market as a "set of missions",
Finding new partnerships to distribute the product,
Finding new distribution channels, for example brick-and-mortar stores or online sales.
Quadrant IV - Diversification
The "bottom-right" quadrant represents Diversification and stands for the biggest change of all. The company moves away from both its product line and its GO-TO-MARKET strategy.
In terms of risk, this is the riskiest strategy and often brings major organizational change. At the same time, it is the most important for the long-term sustainability of a company's growth. Diversification always comes in two types:
Related diversification, where the company expands into new markets and products that are still distantly similar to its current portfolio.
Wholly distinct diversification, where the company expands into new markets and products that are completely different from its current portfolio. Here the company runs an extensive evaluation of the strategy, one that not only determines whether diversifying in this direction makes sense but also aligns the business strategy at the management level (create alignment).
Prioritization Example
Quadrant I - Product Development
Agile software development is the best example: we gradually improve the features of an existing product.
Apple introduces new products such as the iPhone, Apple Watch, or AirPods for its existing customers.
Quadrant II - Market Penetration
Sellers typically look for new buyers of an existing product while also increasing its sales through various bundle options.
Coca-Cola increases sales of classic Coca-Cola through promotions, advertising, and expanded distribution in countries where it already operates.
Quadrant III - Market Development
Product managers often take an existing product (for example a mail plane) and repurpose it for something else (for example a plane for carrying passengers).
Starbucks expands into new countries (e.g. China or India) with the same coffee products it sells in the US.
Quadrant IV - Diversification
A pivot into a new area completely changes a company's business DNA (for example, Amazon pivoted into cloud computing with AWS).
Virgin Group launches Virgin Galactic (space tourism).
Visual Prioritization Example
Other Names for the Framework
Product-Market Growth Matrix,
Product/Market Expansion Grid.