_edited.png)
RICE framework
- Tomáš Veselý - podpořen AI

- 25. 10. 2025
- Minut čtení: 2
Aktualizováno: 3. 11. 2025
Tvoříme obsáhlou knihovnu znalostí o produktovém vývoji jako součást naší mise. Knihovna slouží všem, kteří se snaží zlepšit v rozhodování, především v rozhodování o dalším rozvoji produktu. Ať už jsi vynálezce, produktový manažer nebo Chief Product Officer, používání určité rozhodovací metody zvyšuje šanci na vytvoření správných produktů a jejich funkcí pro správné publikum (build the right thing for the right audience). Dnes si představíme RICE framework.
Základní informace
Název frameworku: RICE.
Vynálezce: Sean McBride a jeho kolegové, Intercom.
Rok prvního použití: 2015.
Odkaz na původní výzkum: RICE: Simple prioritization for product managers.
Důležité osobnosti v rozvoji frameworku:
Zaměstnanci Intercomu,
Brian Balfour,
Melissa Perri,
John Cutler.
Důležité milníky v rozvoji frameworku:
Intercom on Product Management (e-kniha).
Kontext prvního použití
RICE je nástroj pro zpřesnění pořadí nápadů, které má produktový manažer dále posuzovat a určit jejich další rozvoj. Framework také pomáhá při hodnocení nápadů a přesvědčování ostatních, proč jsou určité nápady lepší než jiné.
Základní princip prioritizace
Cílem RICE je zprioritizovav další rozvoj skrze 4 parametry:
R = anglické reach, neboli odhad "Kolik lidí naše funkce nebo produkt zasáhne či nějak ho použije za daný čas" vyjádřeno číslem.
I = anglické impact, je číslená hodnota vyjadřující očekávaný dopad na měřitelný výsledek.
C = anglické confidance, je číselná hodnota vyjadřující pocit/míru jistoty v odhadovaných číslech (R, I, E).
E = anglické effort, neboli číselný údaj o míře nutného úsilý pro vytvoření dané funkce nebo určitého produktu.
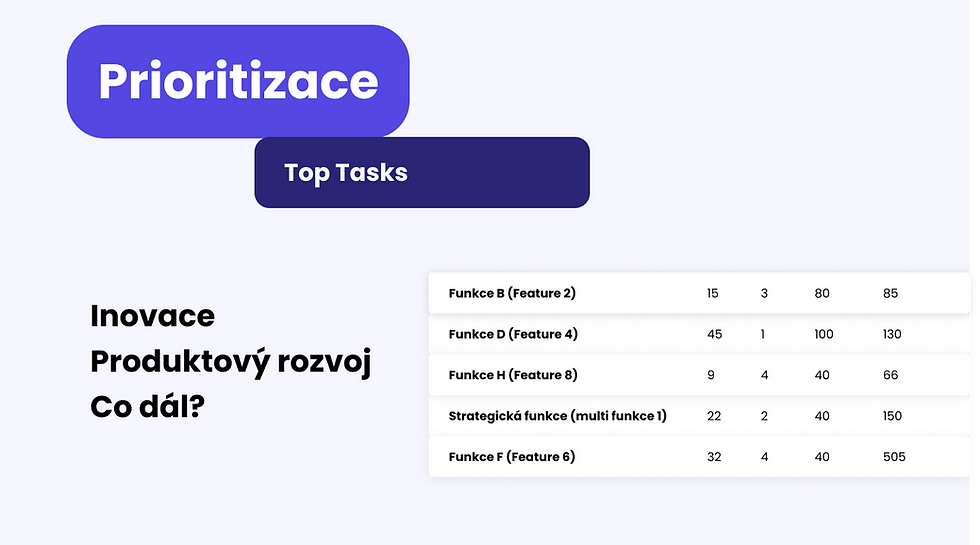
Každou potenciální novou funkci nebo produkt ohodnotíme podle parametrů reach, impact, confidance a effort. Vše poté vložíme do vzorce níže.
Nejvyšší hodnoty představují největší přínos pro další rozvoj (přesněji řešeno, nejvyšší přínos pro investovaný čas). Tyto nápady jsou tedy vítězi.

Ukázka prioritizace
U všech hodnot je zcela na nás, jak je definujeme. Důležité je ale dodat, že definuce musí být stejná napříč všemi hodnocenými funkcemi a produkty, jinak porovnání nebude dávat smysl. Hodnoty musí být také vždy aktuální. To může být problém v případě, kdy máme tisíce funkcí a stovky produktů.

Reach
Reach můžeme odhadnout jako velikost trhu, který se snažíme obsloužit — například 455 000 uživatelů e-knih v České repblice nebo 15 milionů předplatitelů auto leasingu v Německu.
Impact
Impact můžeme ohodnotit jako skutečný dopad vyjádřený číslem — například 50 000 notifikací bude pozitivně ovlivněno. Můžeme jej ale hodnotit také relativně, na určité stupnici, která vyjadřuje hypotetický dopad pomocí čísla, například 3 nebo 0,5.
Confidance
Confidance je číselná hodnota od 0 do 100%. Intercom doporučuje zvolit si několik pevně daných úrovní jistoty, např. 100 %, 80 % nebo 40 %, a podle nich jednotlivé odhady hodnotit.
Effort
Effort hodnotíme jako číslo vyjadřující množství člověkodnů (MD), které jsou potřeba pro doručení celé funkce nebo produktu napříč týmem. Časový interval lze samozřejmě změnit. Příkladem může být 15 MD na doručení dané funkce skrze celý inovační tým.

Komentáře